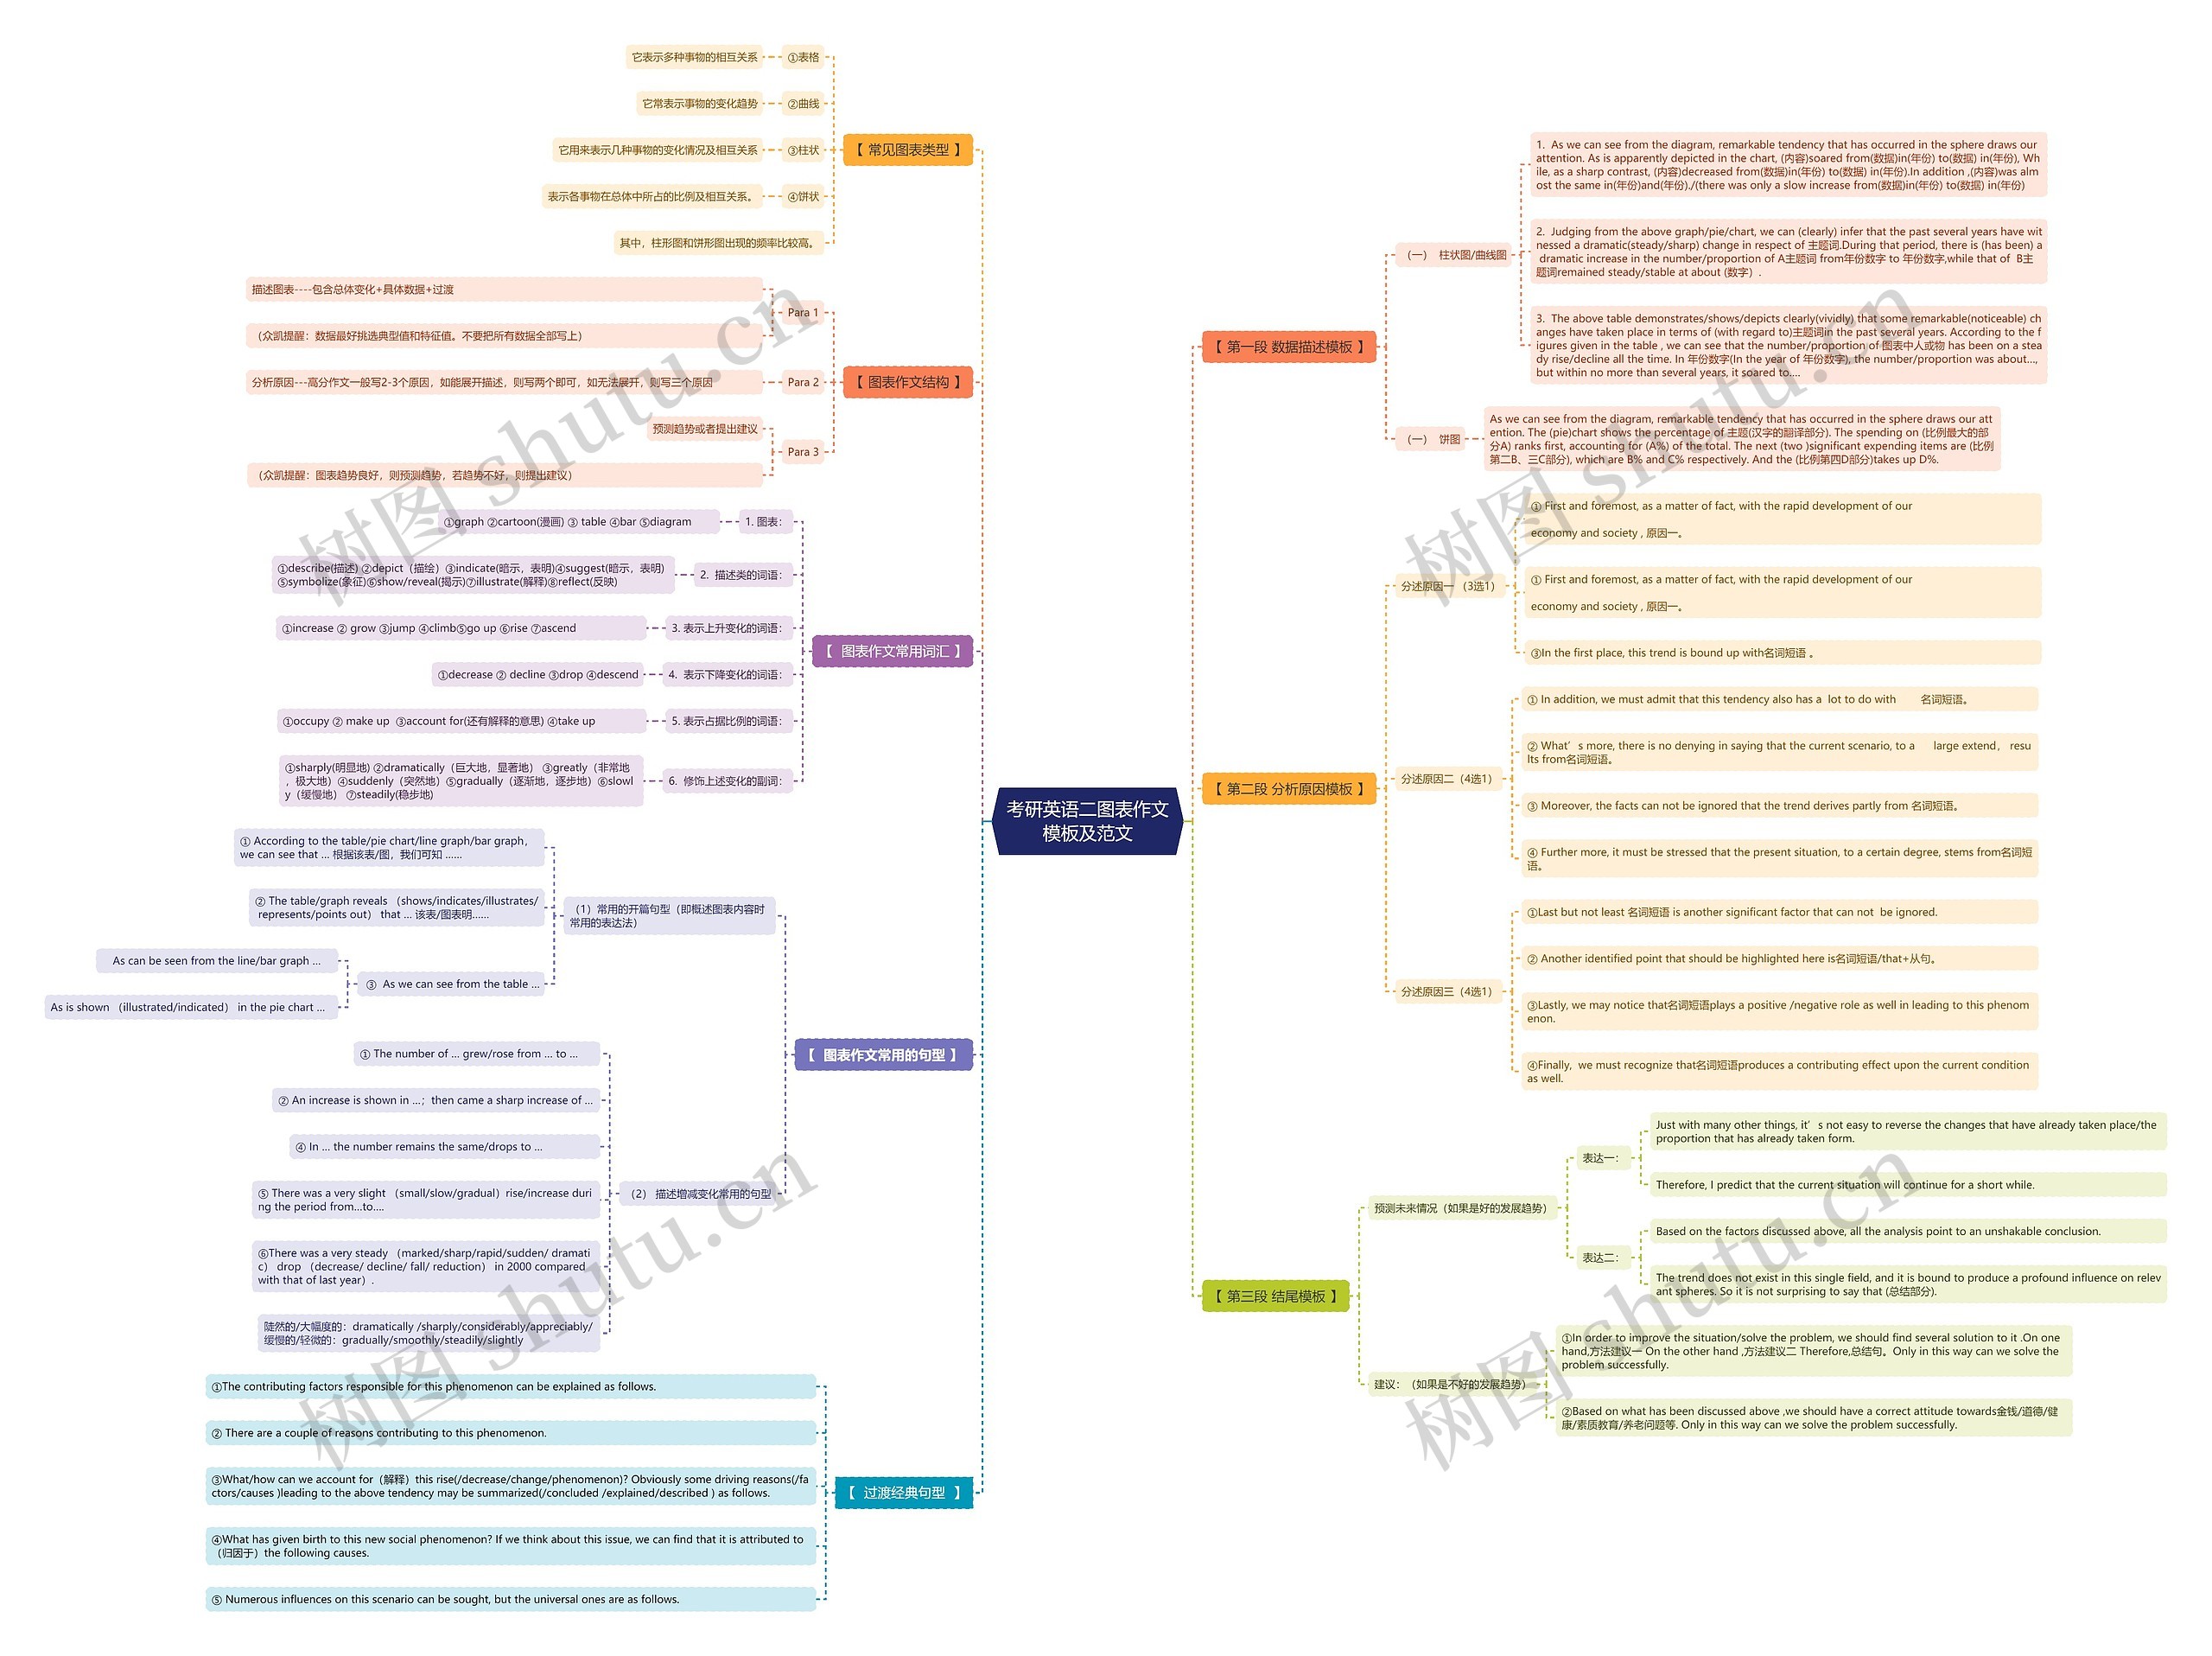
1. As we can see from the diagram, remarkable tendency that has occurred in the sphere draws our attention. As is apparently depicted in the chart, (内容)soared from(数据)in(年份) to(数据) in(年份), While, as a sharp contrast, (内容)decreased from(数据)in(年份) to(数据) in(年份).In addition ,(内容)was almost the same in(年份)and(年份)./(there was only a slow increase from(数据)in(年份) to(数据) in(年份)
2. Judging from the above graph/pie/chart, we can (clearly) infer that the past several years have witnessed a dramatic(steady/sharp) change in respect of 主题词.During that period, there is (has been) a dramatic increase in the number/proportion of A主题词 from年份数字 to 年份数字,while that of B主题词remained steady/stable at about (数字).
3. The above table demonstrates/shows/depicts clearly(vividly) that some remarkable(noticeable) changes have taken place in terms of (with regard to)主题词in the past several years. According to the figures given in the table , we can see that the number/proportion of 图表中人或物 has been on a steady rise/decline all the time. In 年份数字(In the year of 年份数字), the number/proportion was about…, but within no more than several years, it soared to….

