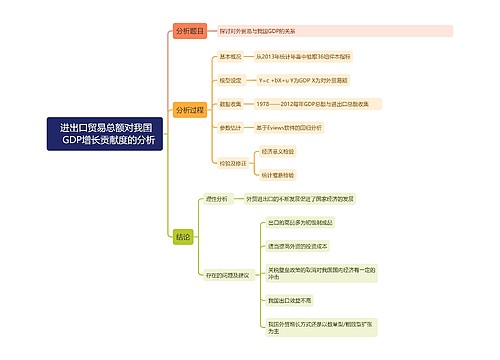
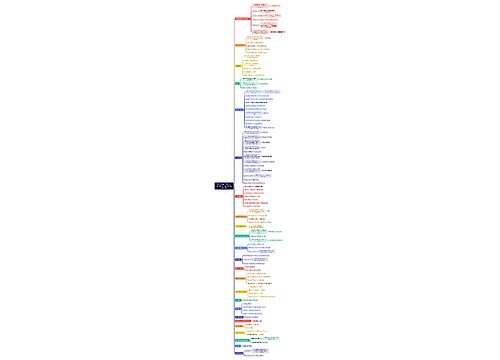
China cross-broder transactions from 2013 to 2018思维导图
U629888440
2023-03-24
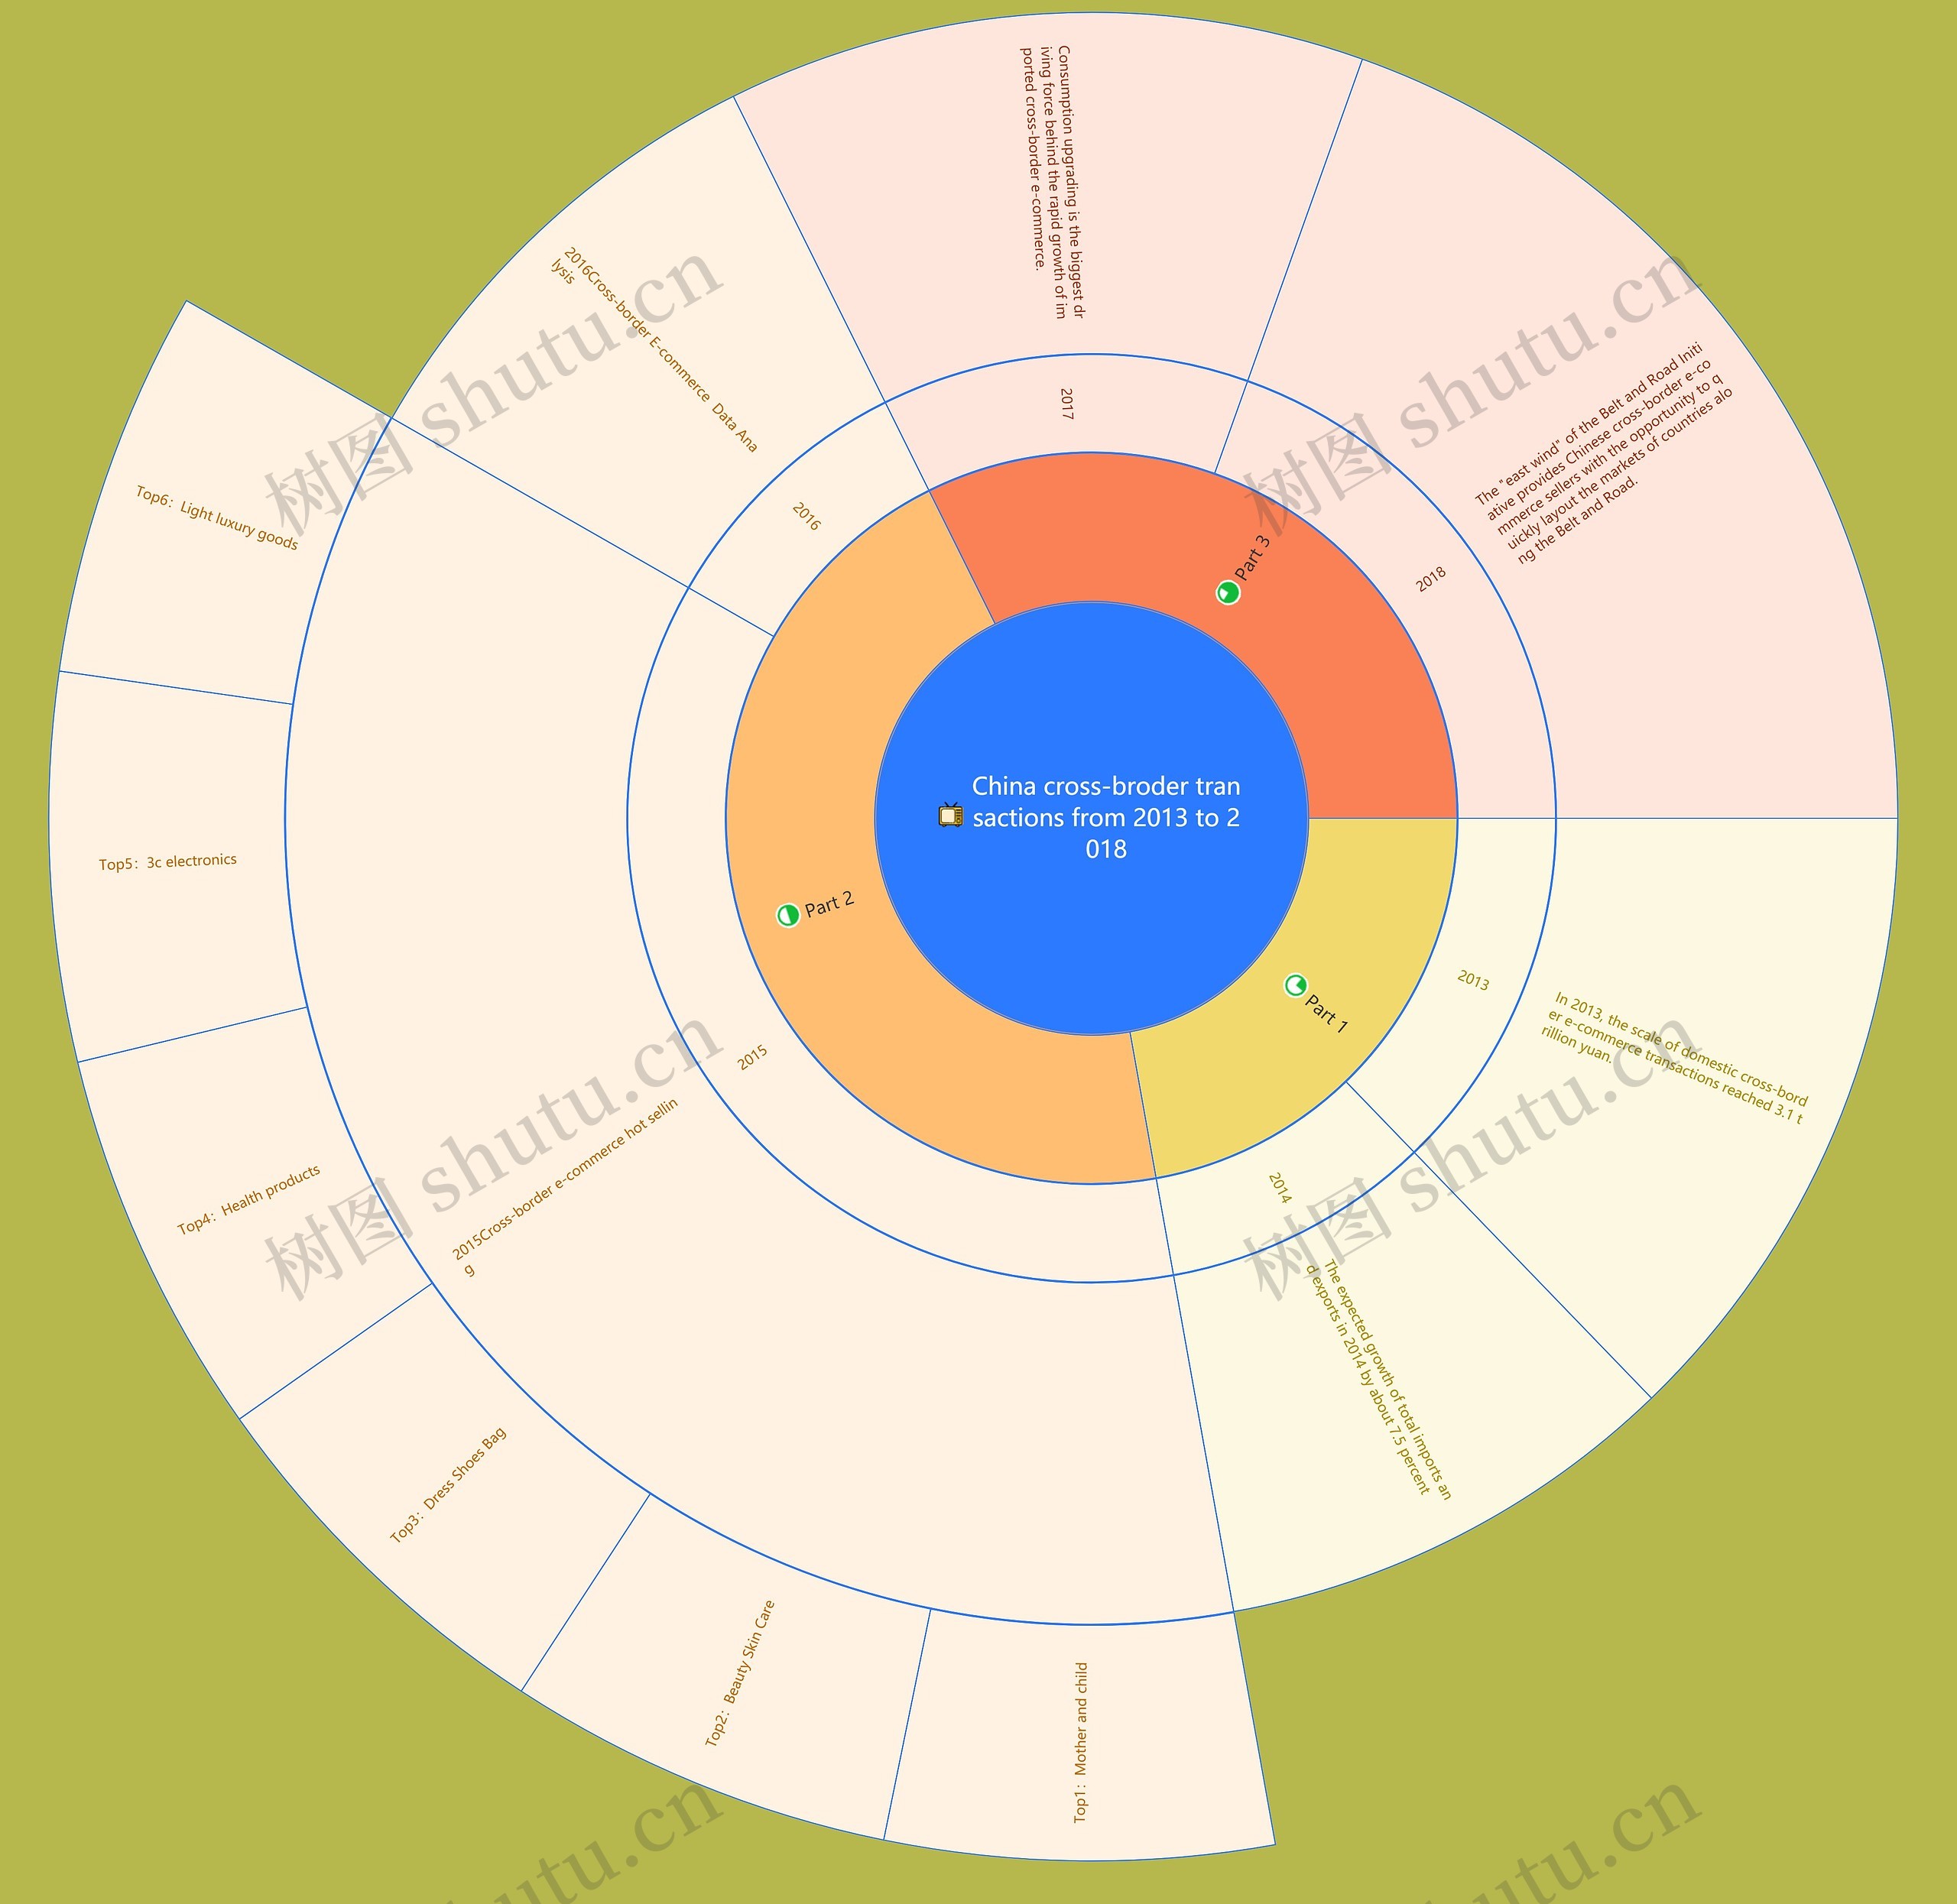
2013年至2018年中国跨境交易
树图思维导图提供《China cross-broder transactions from 2013 to 2018》在线思维导图免费制作,点击“编辑”按钮,可对《China cross-broder transactions from 2013 to 2018》进行在线思维导图编辑,本思维导图属于思维导图模板主题,文件编号是:135f9aa9314bf2b0ac8384751107c89b
思维导图大纲
相关思维导图模版
Mind Map of China's Manufacturing Industry Clusters思维导图
 U369755124
树图思维导图提供《Mind Map of China's Manufacturing Industry Clusters》在线思维导图免费制作,点击“编辑”按钮,可对《Mind Map of China's Manufacturing Industry Clusters》进行在线思维导图编辑,本思维导图属于思维导图模板主题,文件编号是:5a42968c95a13d4b0c38c9bc813ef6a0
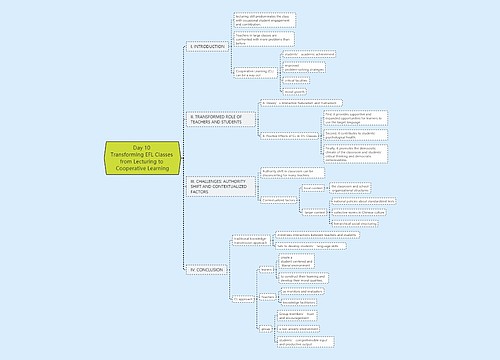
Day 10 Transforming EFL Classes from Lecturing to Cooperative Learning思维导图
 U729096222
树图思维导图提供《Day 10 Transforming EFL Classes from Lecturing to Cooperative Learning》在线思维导图免费制作,点击“编辑”按钮,可对《Day 10 Transforming EFL Classes from Lecturing to Cooperative Learning》进行在线思维导图编辑,本思维导图属于思维导图模板主题,文件编号是:98f204eb10b229305f3781a0e947c0f4
